
Set of 5 infographics on statistics for The Cup Effect, illustrated infographics final.
Illustrated Stats for Social Media Campaign - The Cup Effect
The Brief: To create fun illustrations that advertise statistics related to period poverty for the company The Cup Effect for sharing on social media to bring awareness to their cause.
Role: Illustrator responsible for concept, design, and implementation of all lettering and illustration. Assisted with concepts and data by Pip Christie.
Tools Used: iPad Pro, Procreate app, Apple Pencil.
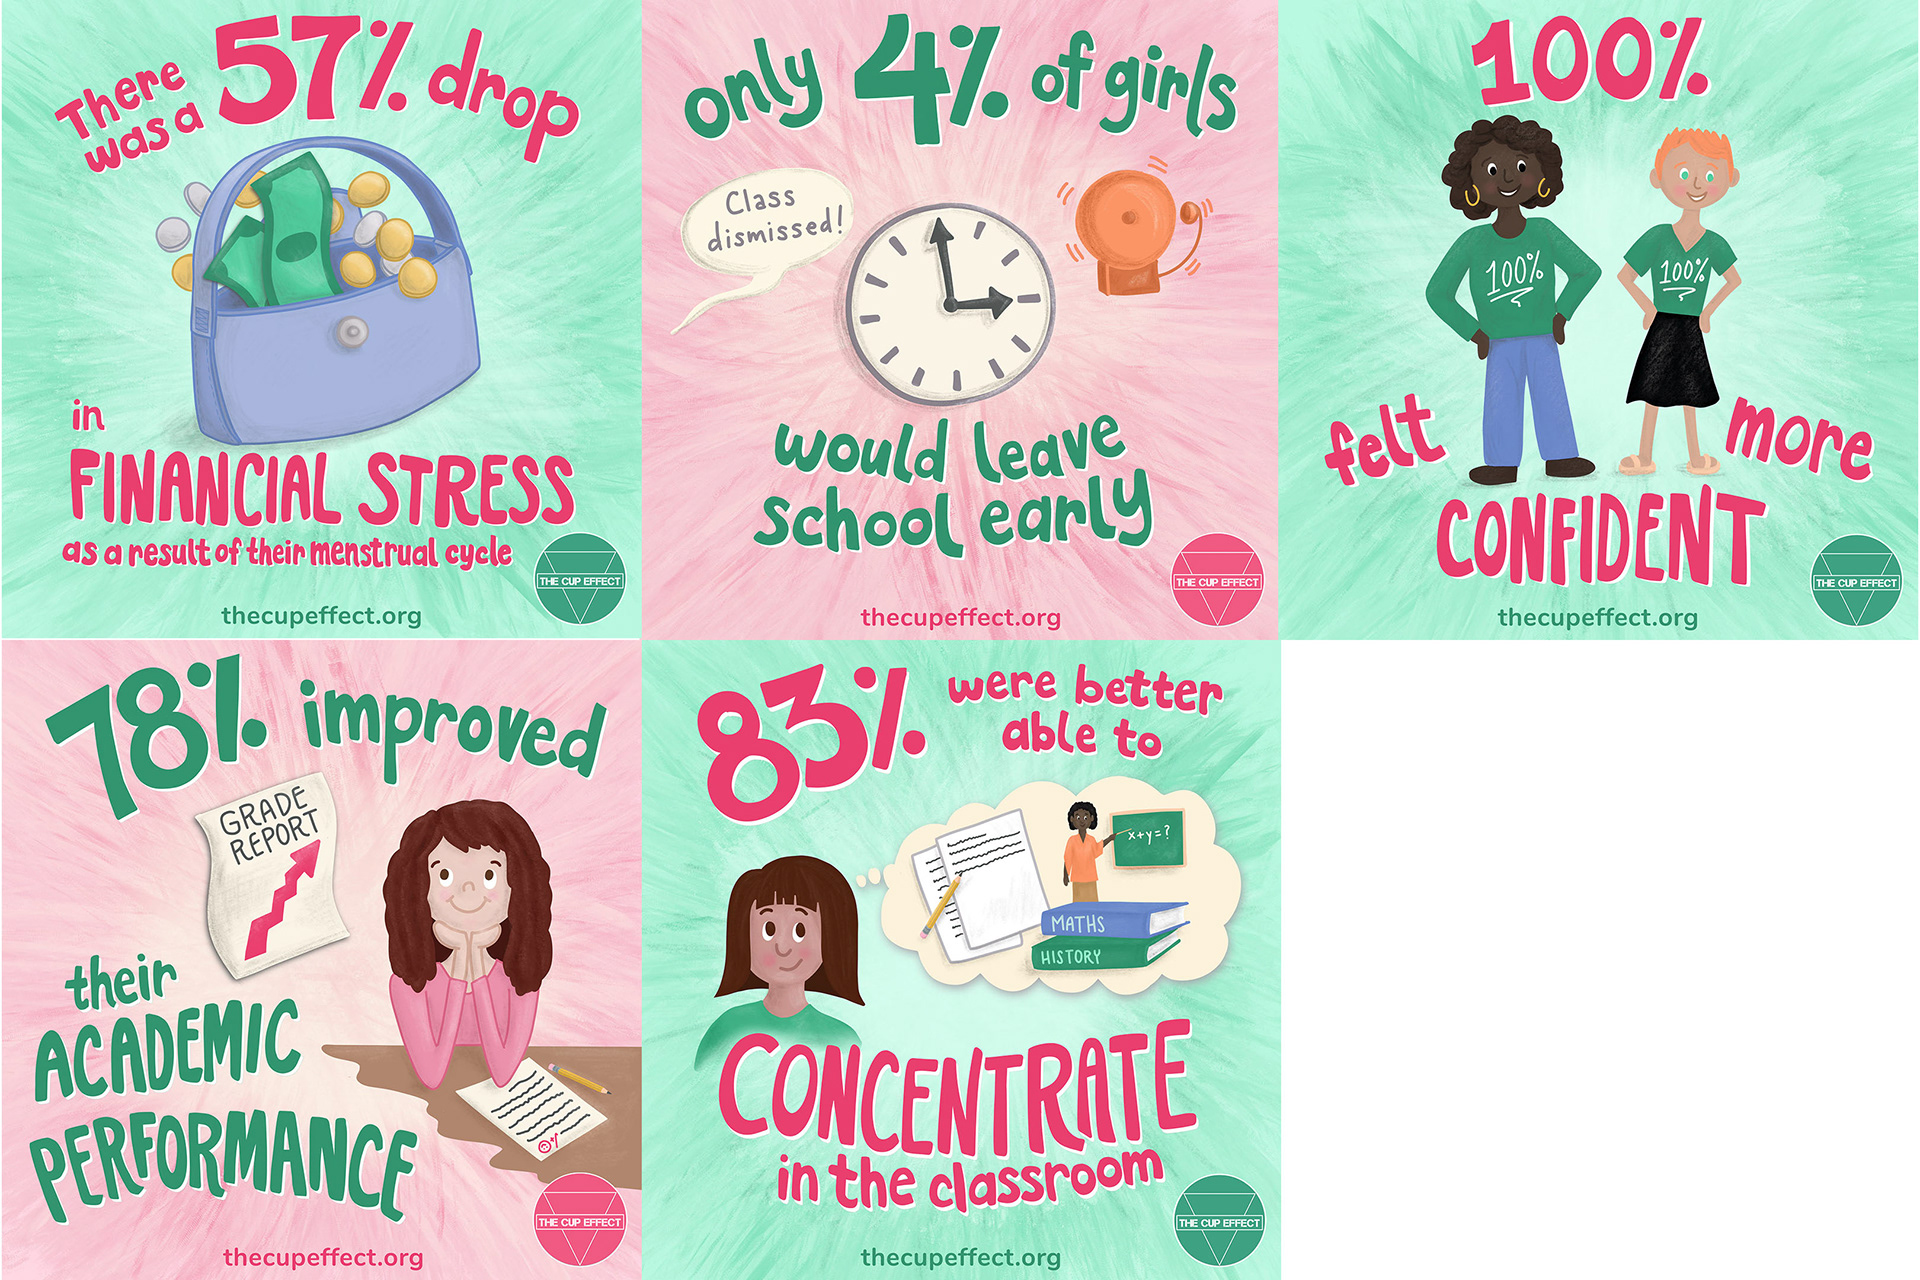
In partnership with The Cup Effect, I’m helping to create new illustrated statistics and infographics that match their current branding and that are visually enticing for sharing and marketing on social media. The Cup Effect is a great cause that helps women who can’t afford period products to get resources so they can stay in school and not feel a financial burden due to biology. Find out more about their great cause here: https://www.thecupeffect.org/.

Initial infographic sketches showing some of the process and ideas.

Final of the More Confident illustrated infographic.
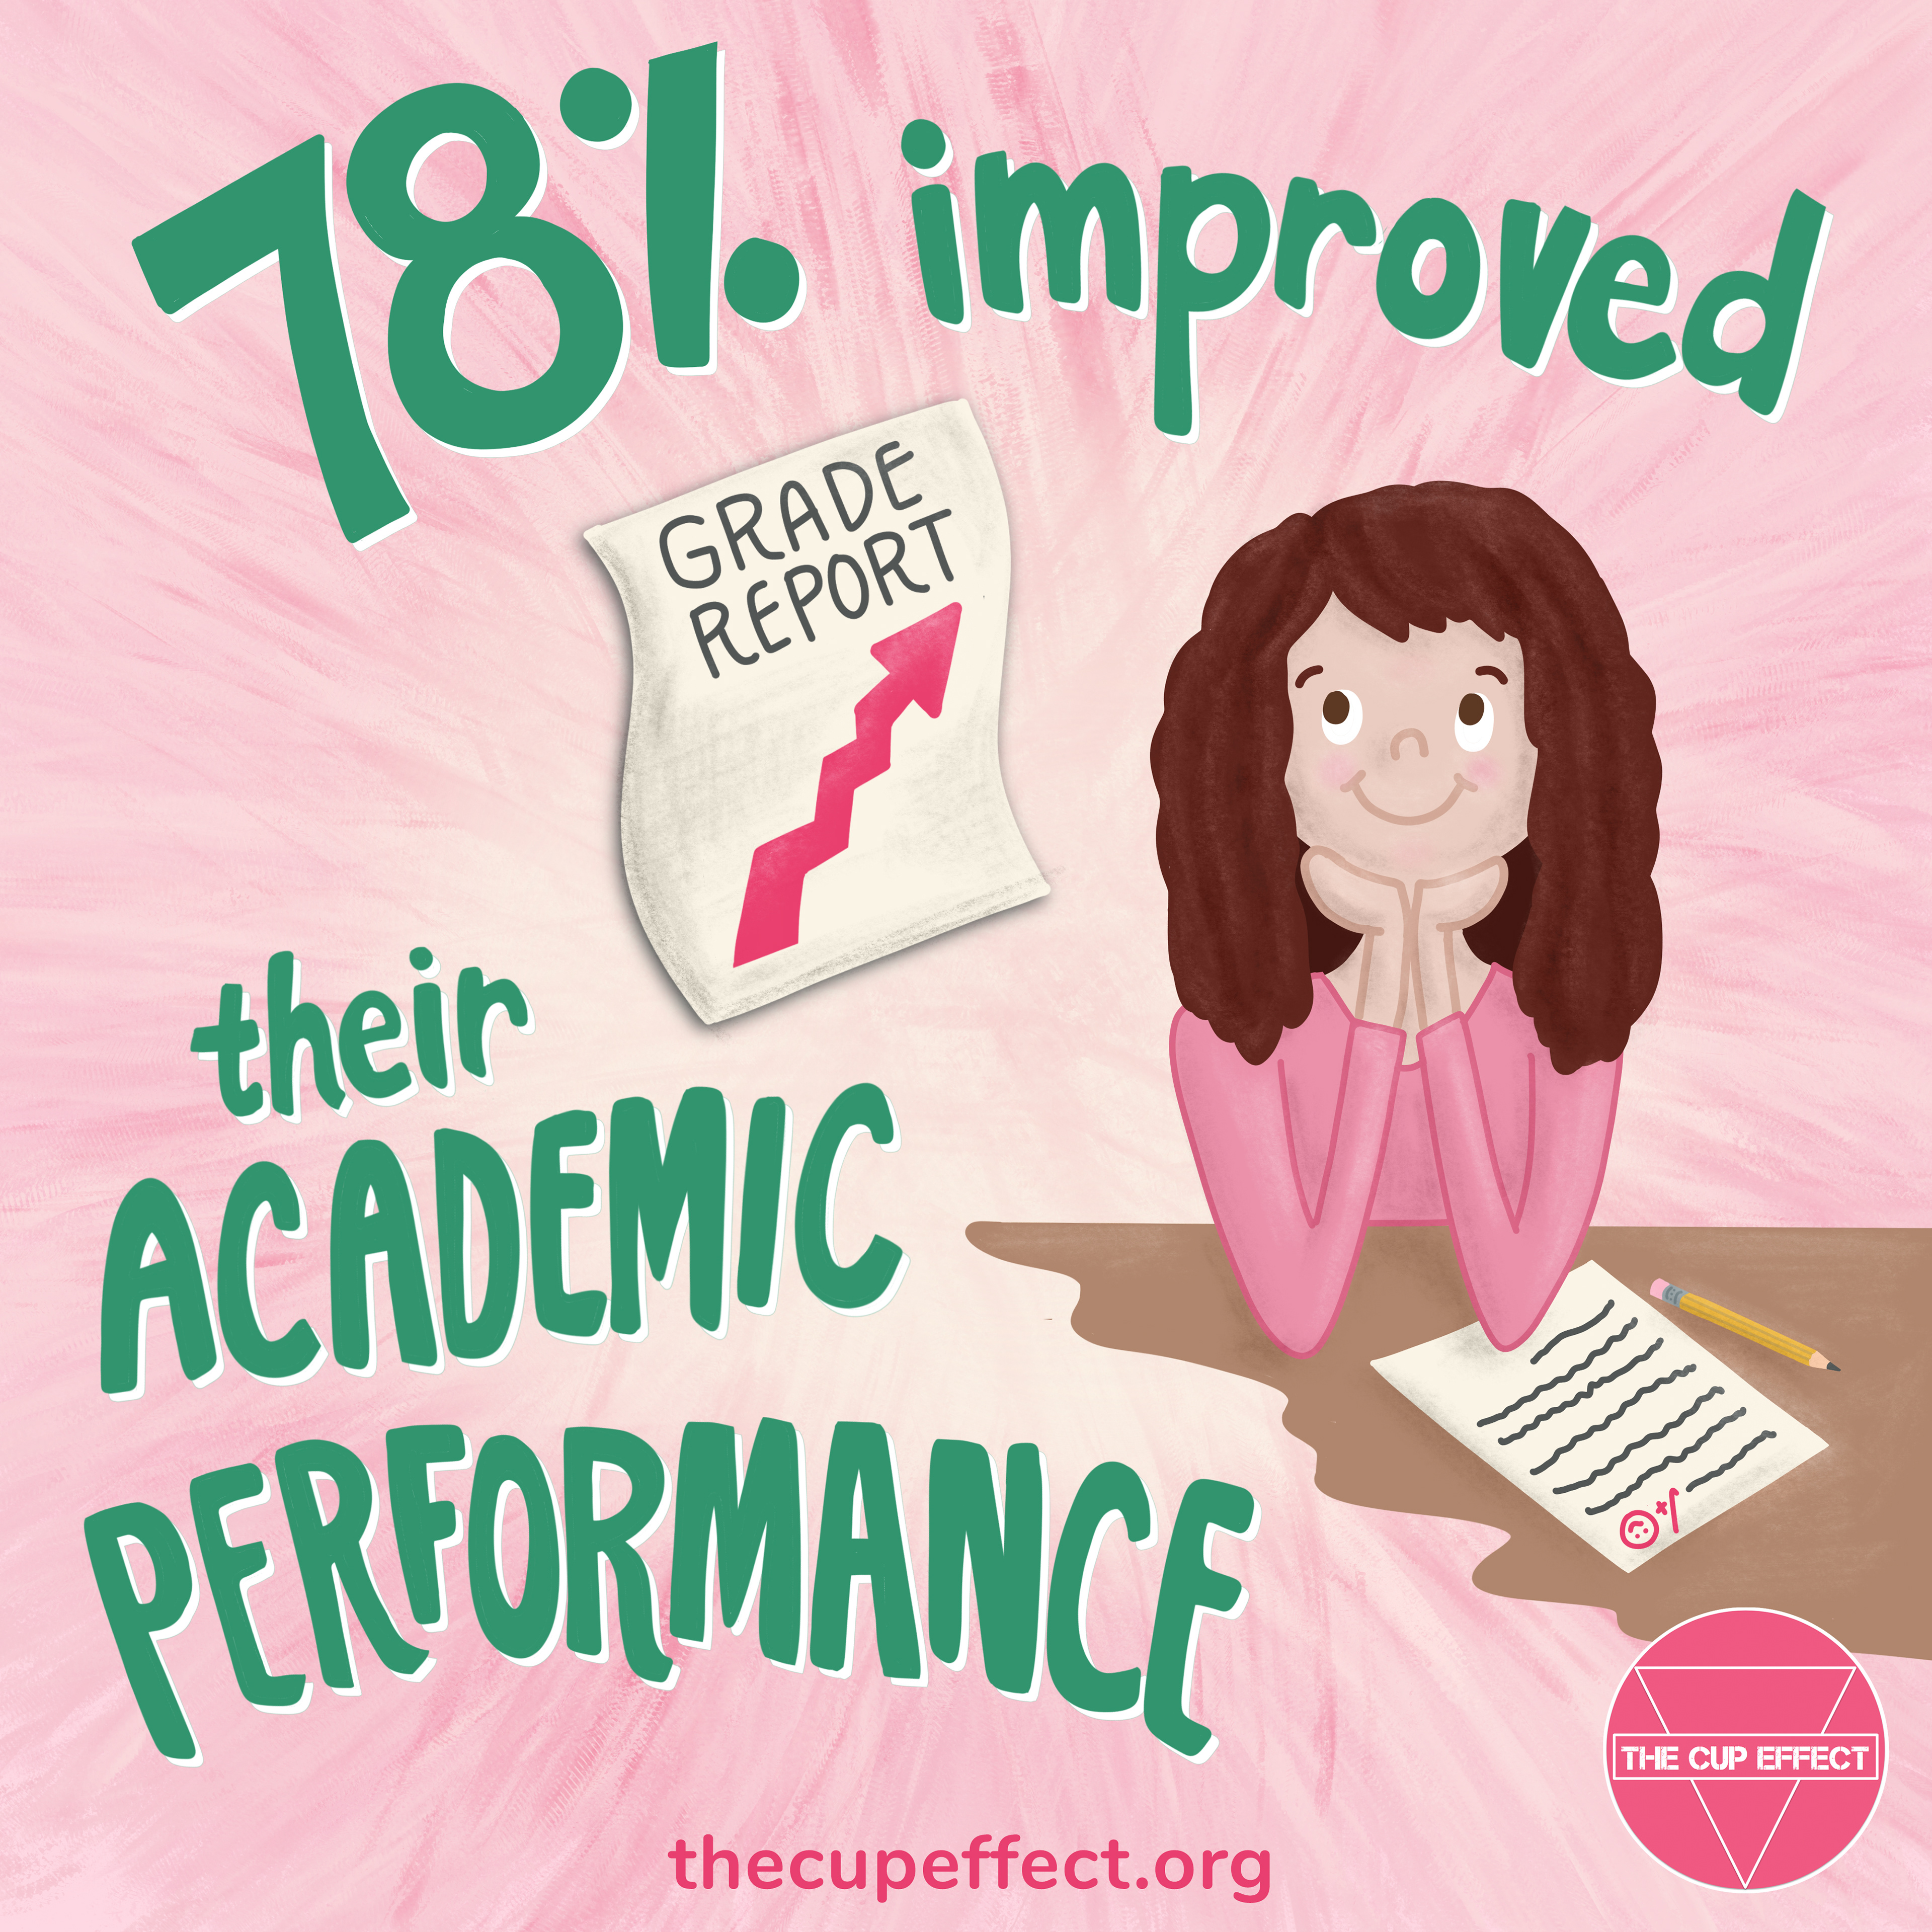
Final of the Academic Performance illustrated infographic.

Final of the Concentrate illustrated infographic.
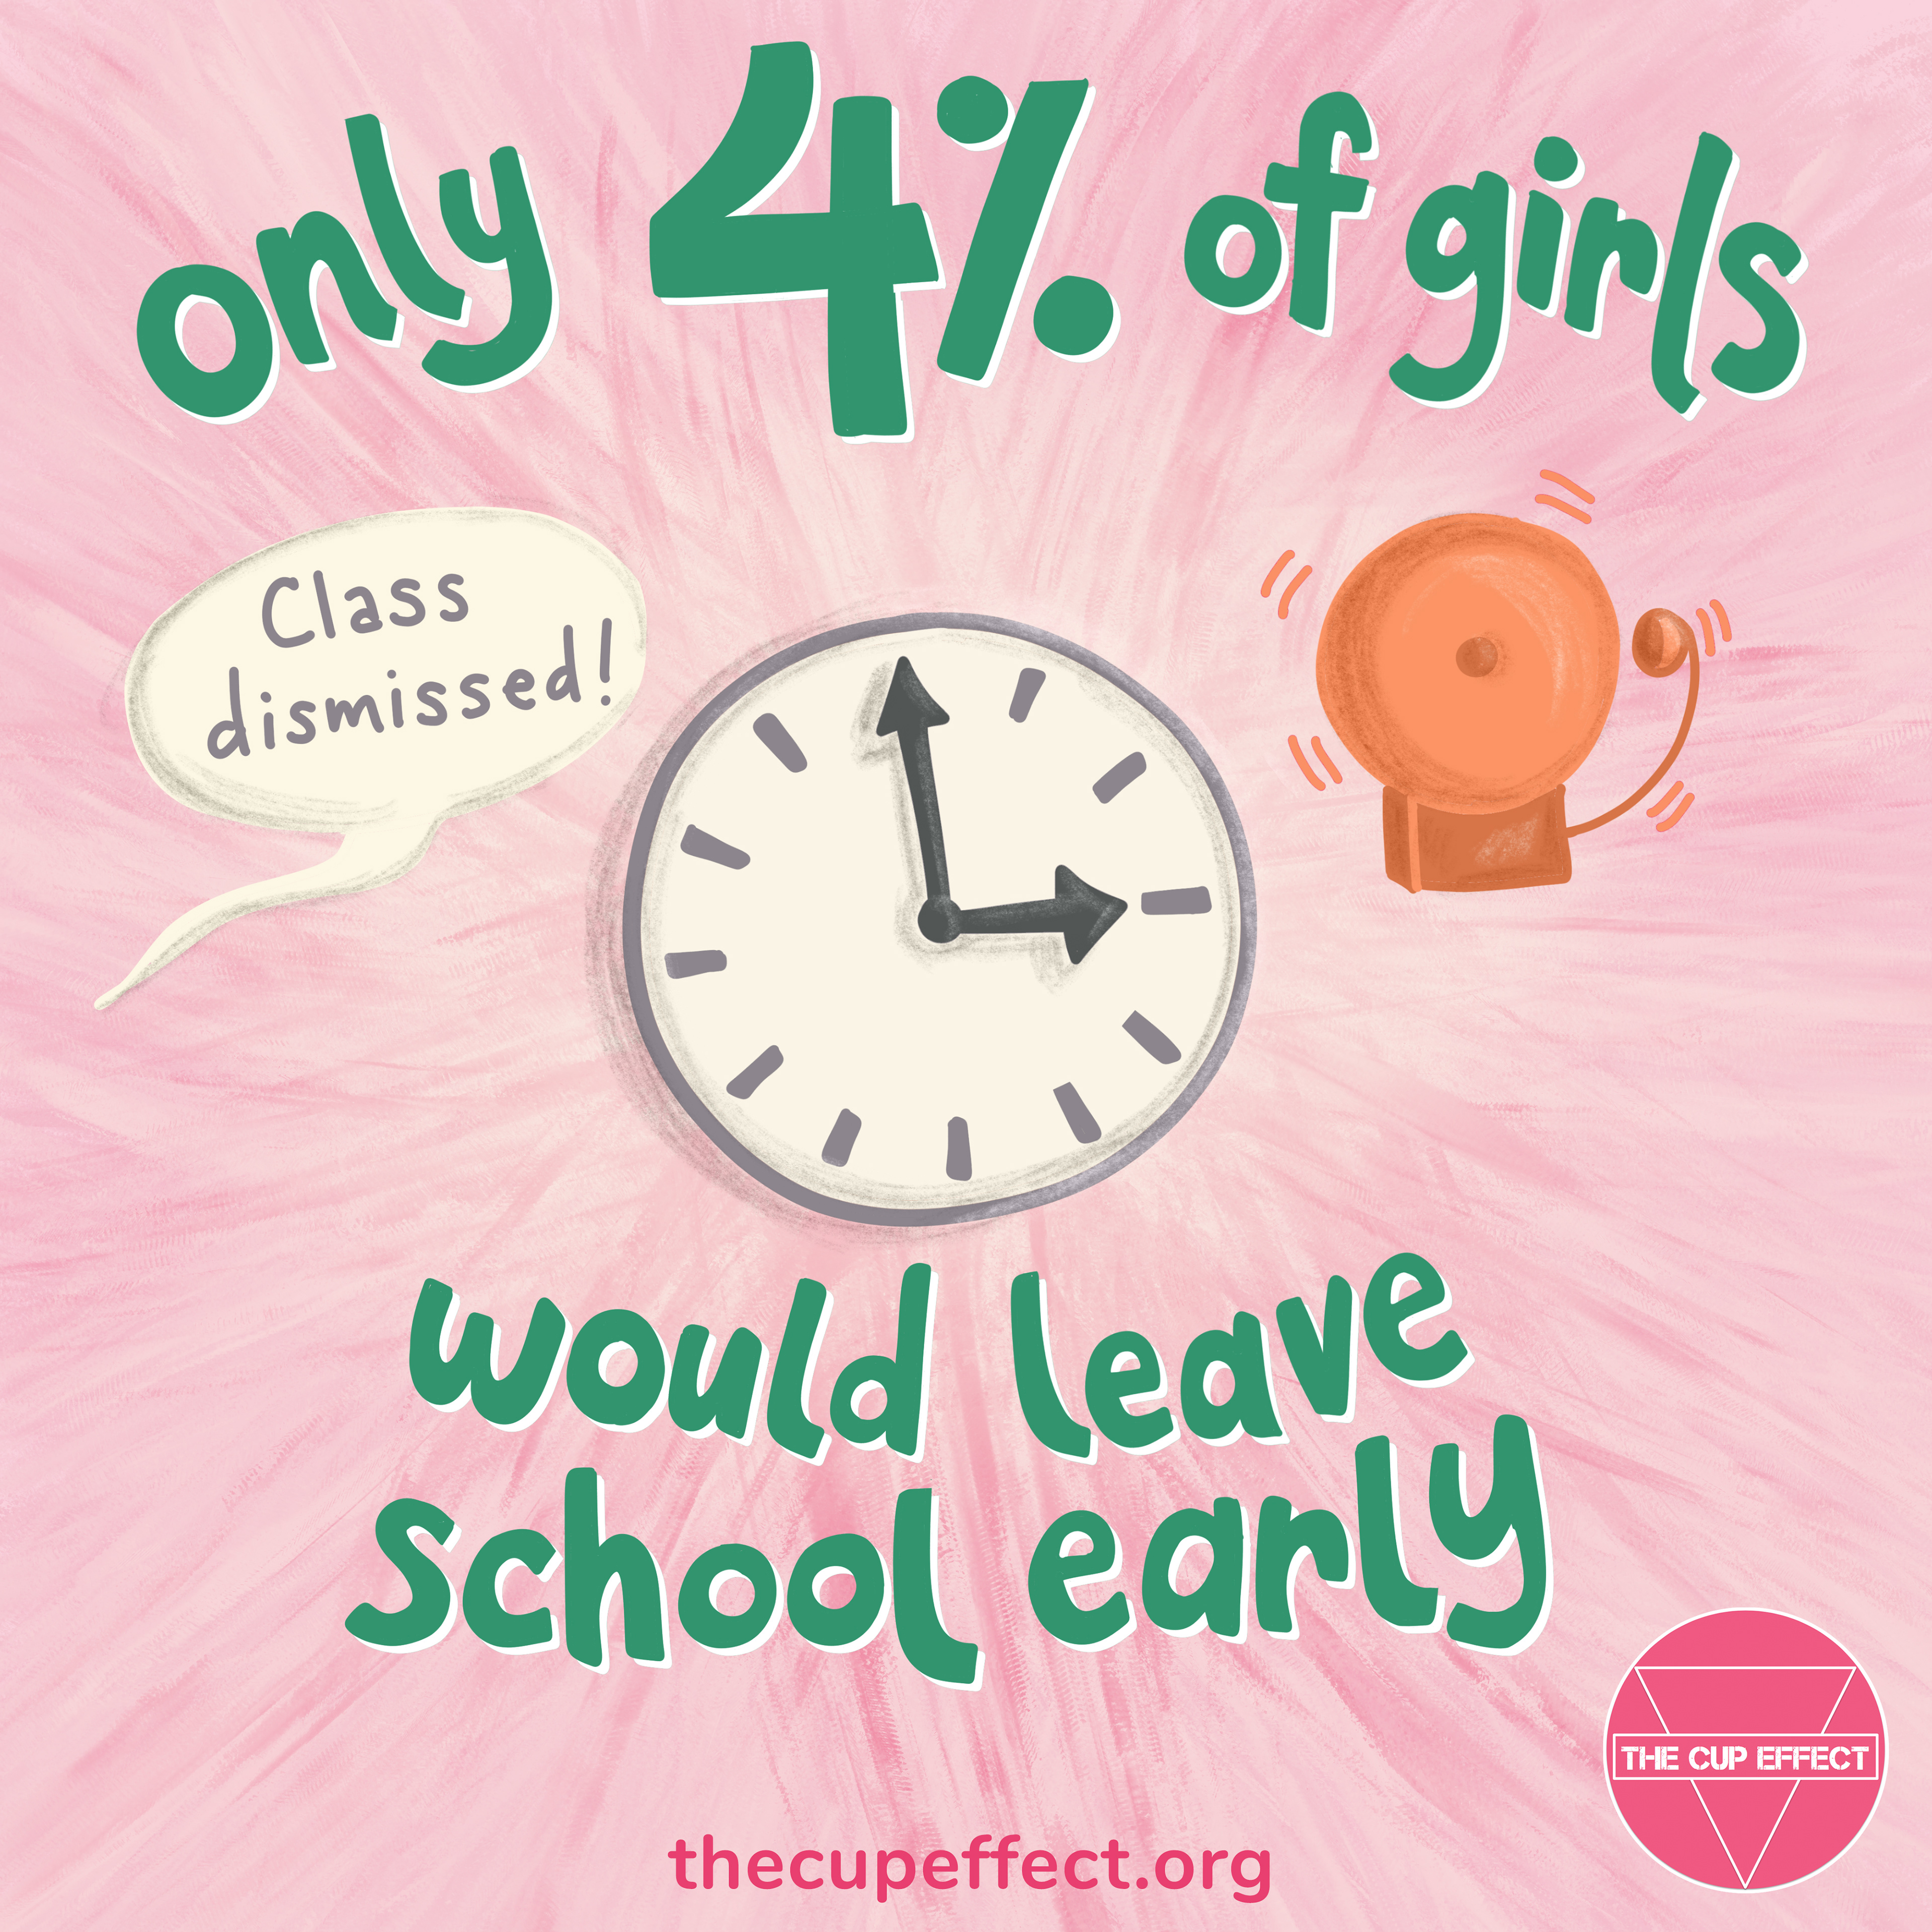
Final of the Leave School Early illustrated infographic.
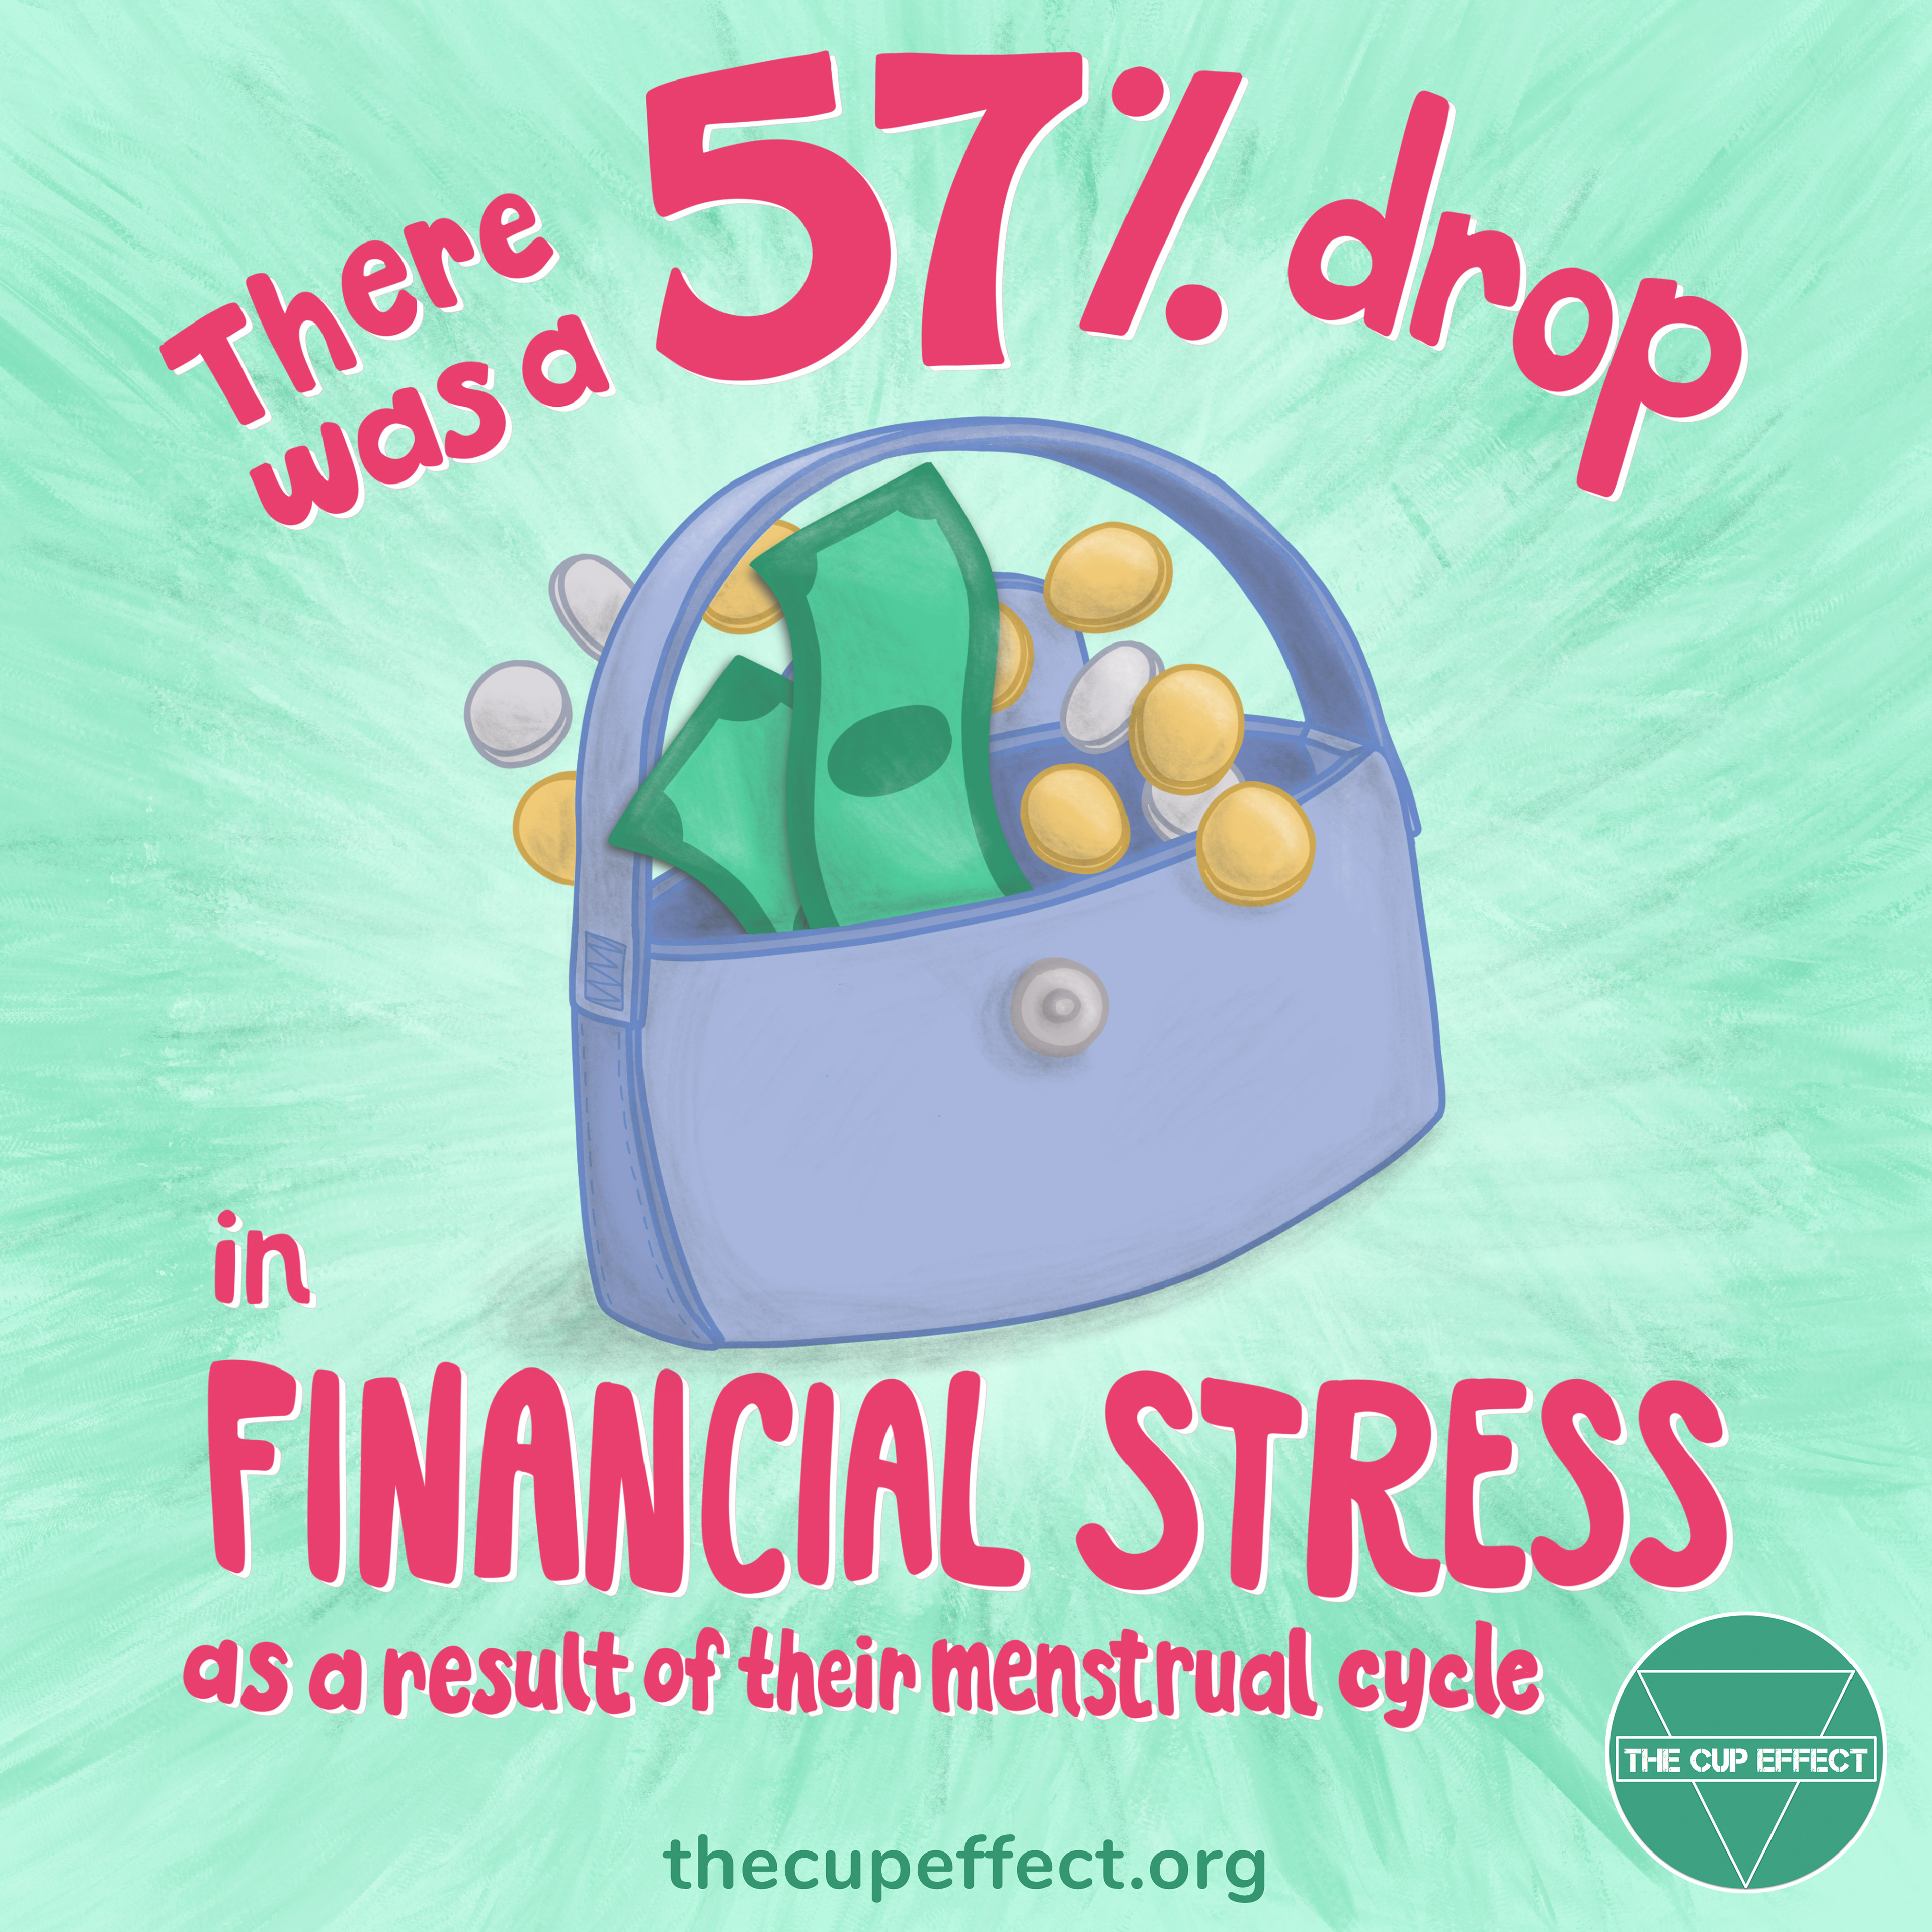
Final of the Financial Stress illustrated infographic.
Thanks for checking out my work! ;o)
See more of my work at www.jenniferhines.design.